For my Dear Data Project, I decided to collect data about my phone usage and my complaints. At the beginning, I was very unsure about what I would come up with, especially when it came to how I was going to bring my data visualization to life. However, I am very proud of my full project and learned a lot about myself in the process.
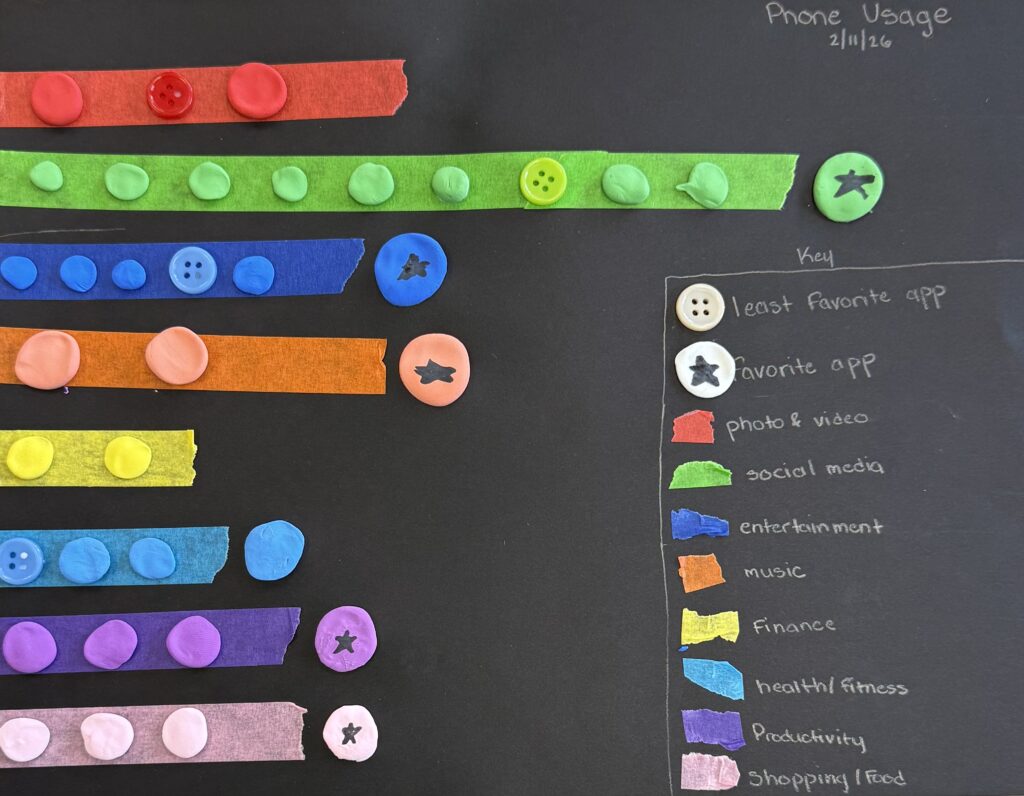
For my short-term data visualization project, I decided to record my phone usage. Before I began this part of my project, I assumed that I spent a good amount of my phone time on productivity apps. It wasn’t until I completed my data collection that I realized I spend most of my time on social media apps. The most difficult part of this assignment was seeing how much time I was seemingly wasting on my phone. I typically try to spend most of my days doing things that do not require the use of my phone, but this project made me realize that I actually use my phone more than I previously thought I did. However, because this part of my overall project focused on short-term data collection, I would say that the easiest part was analyzing what I did on my phone for only a small period of time. In order to track my data, I used my rough-draft, along with my phone to check the apps I use.
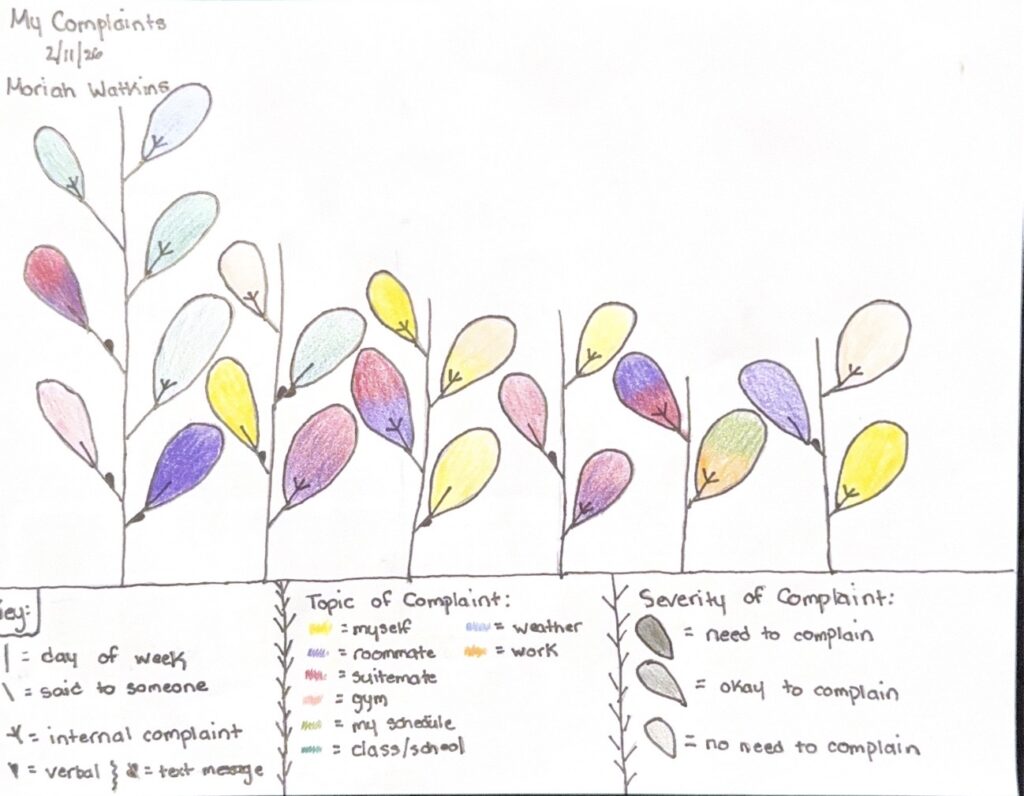
The long-term part of my project was focused on my complaints. Similar to how I felt before I started collecting data for my phone usage, I didn’t think my list of complaints for the week would be very long. It was to my surprise that I did in fact complain more than I initially realized. To start this process, I used the Notes app on my phone to log all of my complaints for the week. One interesting thing I noticed during this part was that many of the complaints I made were about the same thing. Another area that I thought was interesting was the difference between the internal and external complaints I was making. Even though it was hard to see my complaints written down in front of me, I was also happy that I chose to collect data on my complaints because I can now identify the patterns within my complaints. To be transparent, there wasn’t anything I would consider to be “easy” with this assignment. Logging my complaints was already tough enough, so it made things even more challenging when I had to find a way to visualize them. Luckily, I was able to find a way that I felt best expressed my data and made it easier to understand to other viewers.
Overall, this was a project that I never saw myself doing, but I am glad I had to. Not only did I learn about myself, but I also learned how anything can be turned into data. The smallest areas of our daily lives can somehow be turned into a data visualization project.
Below are my 2 projects:
Leave a Reply